
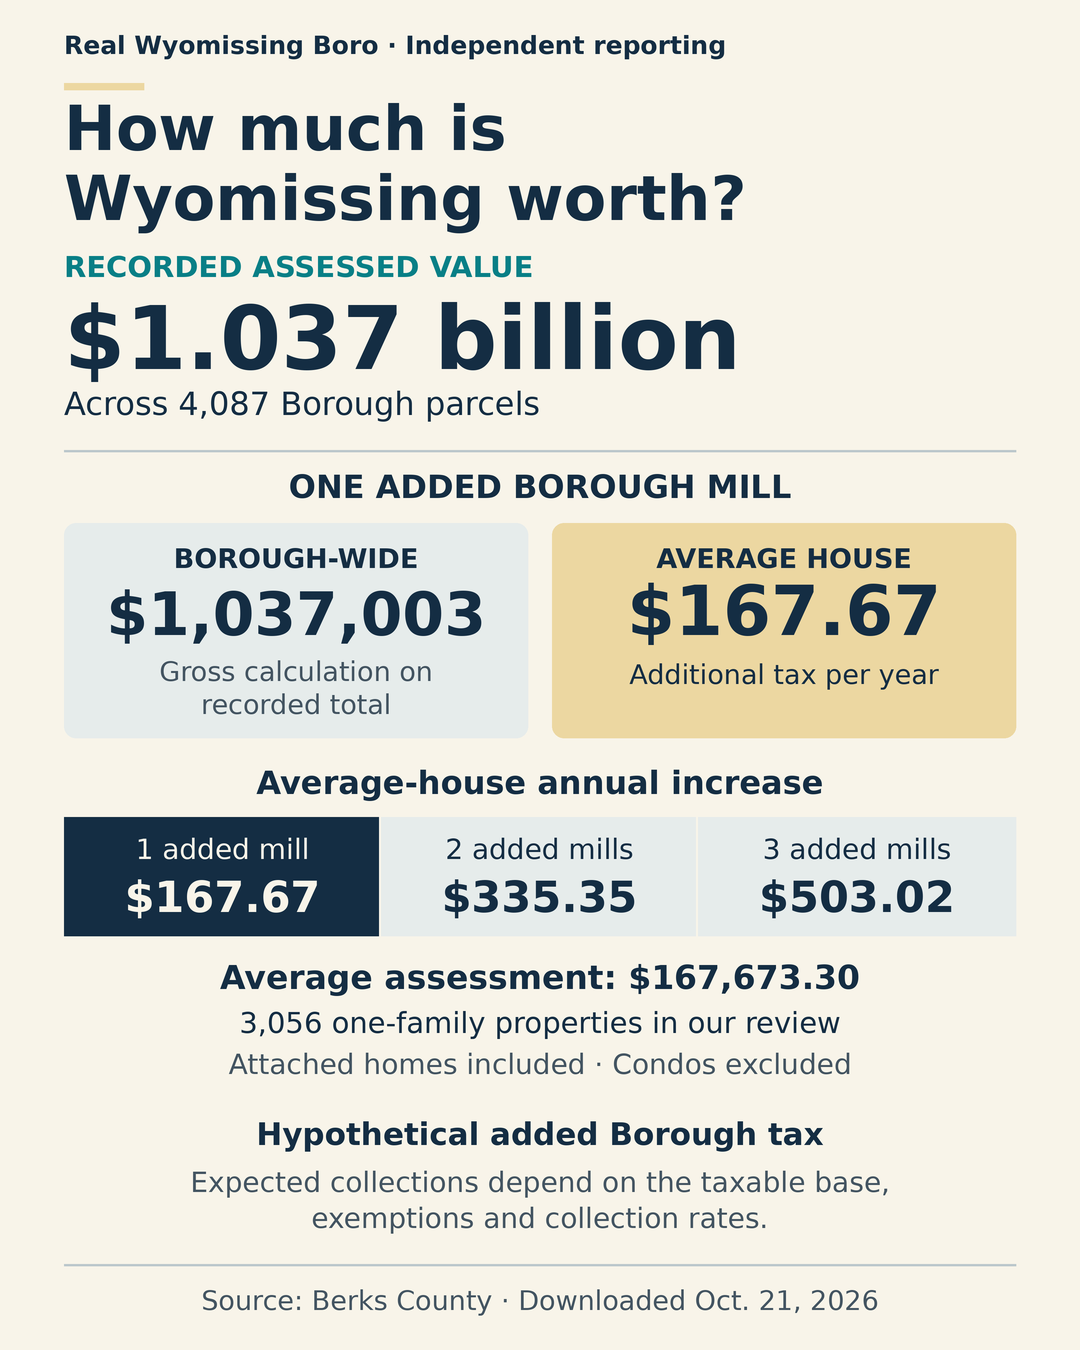
County records list $1,037,003,000 in assessed property value across 4,087 Wyomissing parcels — about $1.037 billion.
Applied to that recorded total, one mill works out to $1,037,003 a year in a gross calculation — roughly $1.04 million.
The increases below are hypothetical. They do not report a proposed or adopted tax increase. The Borough-wide amounts are gross calculations on recorded assessments, not certified expected revenue.
What one mill means for the Borough
A mill is one-thousandth. In property taxes, one mill means $1 a year for every $1,000 of assessed value.
The Borough-wide arithmetic starts here:
$1,037,003,000 ÷ 1,000 = $1,037,003 per mill.
Applying one, two or three added mills to that full recorded total gives:
| Added mills | Gross annual calculation on the recorded total |
|---|---|
| 1 mill | $1,037,003 |
| 2 mills | $2,074,006 |
| 3 mills | $3,111,009 |
These figures show the scale of a mill across the Borough. The household side follows the same arithmetic, applied to an individual property's assessment.
How we get the average house
From the Borough-wide records, we identified 3,056 properties classified as one-family houses, each with one recorded living unit and a positive assessment. This group includes attached houses, rowhouses and doubles; condos and apartment buildings are excluded.
Together, these properties have $512,409,600 in recorded assessments. Dividing that total by the number of properties gives the average:
$512,409,600 ÷ 3,056 = $167,673.30.
At that average assessment, one added mill would mean $167.67 more a year in Borough property tax. Two mills would add $335.35; three mills, $503.02.
That is the connection: the same extra mill has a gross value of about $1.04 million across the full recorded Borough total and an annual cost of about $168 at the reviewed house group's average assessment.
The median, lowest and highest house assessments
The average does not describe every house. The median — the midpoint of the reviewed group — is $139,300. At least half the properties fall at or below that midpoint, and at least half at or above it.
The lowest assessment in the group is $39,900. The highest is $1,040,600. The middle half of the group's assessments falls between $96,600 and $205,400.
Here is what the same increases would mean across those examples. Every tax figure below is an additional annual Borough charge:
On a small screen, swipe across the table to see every column.
| Assessment within the reviewed group | Assessed value | +1 mill | +2 mills | +3 mills |
|---|---|---|---|---|
| Lowest | $39,900 | $39.90 | $79.80 | $119.70 |
| Median | $139,300 | $139.30 | $278.60 | $417.90 |
| Average | $167,673.30 | $167.67 | $335.35 | $503.02 |
| Highest | $1,040,600 | $1,040.60 | $2,081.20 | $3,121.80 |
At three added mills, the annual increase ranges from $119.70 at the lowest assessment to $3,121.80 at the highest, with $417.90 at the median and $503.02 at the average.
How to calculate your own increase
Look for the “Assessment” row on your Borough/County tax bill, then find “Taxable AV” — the taxable assessed value.
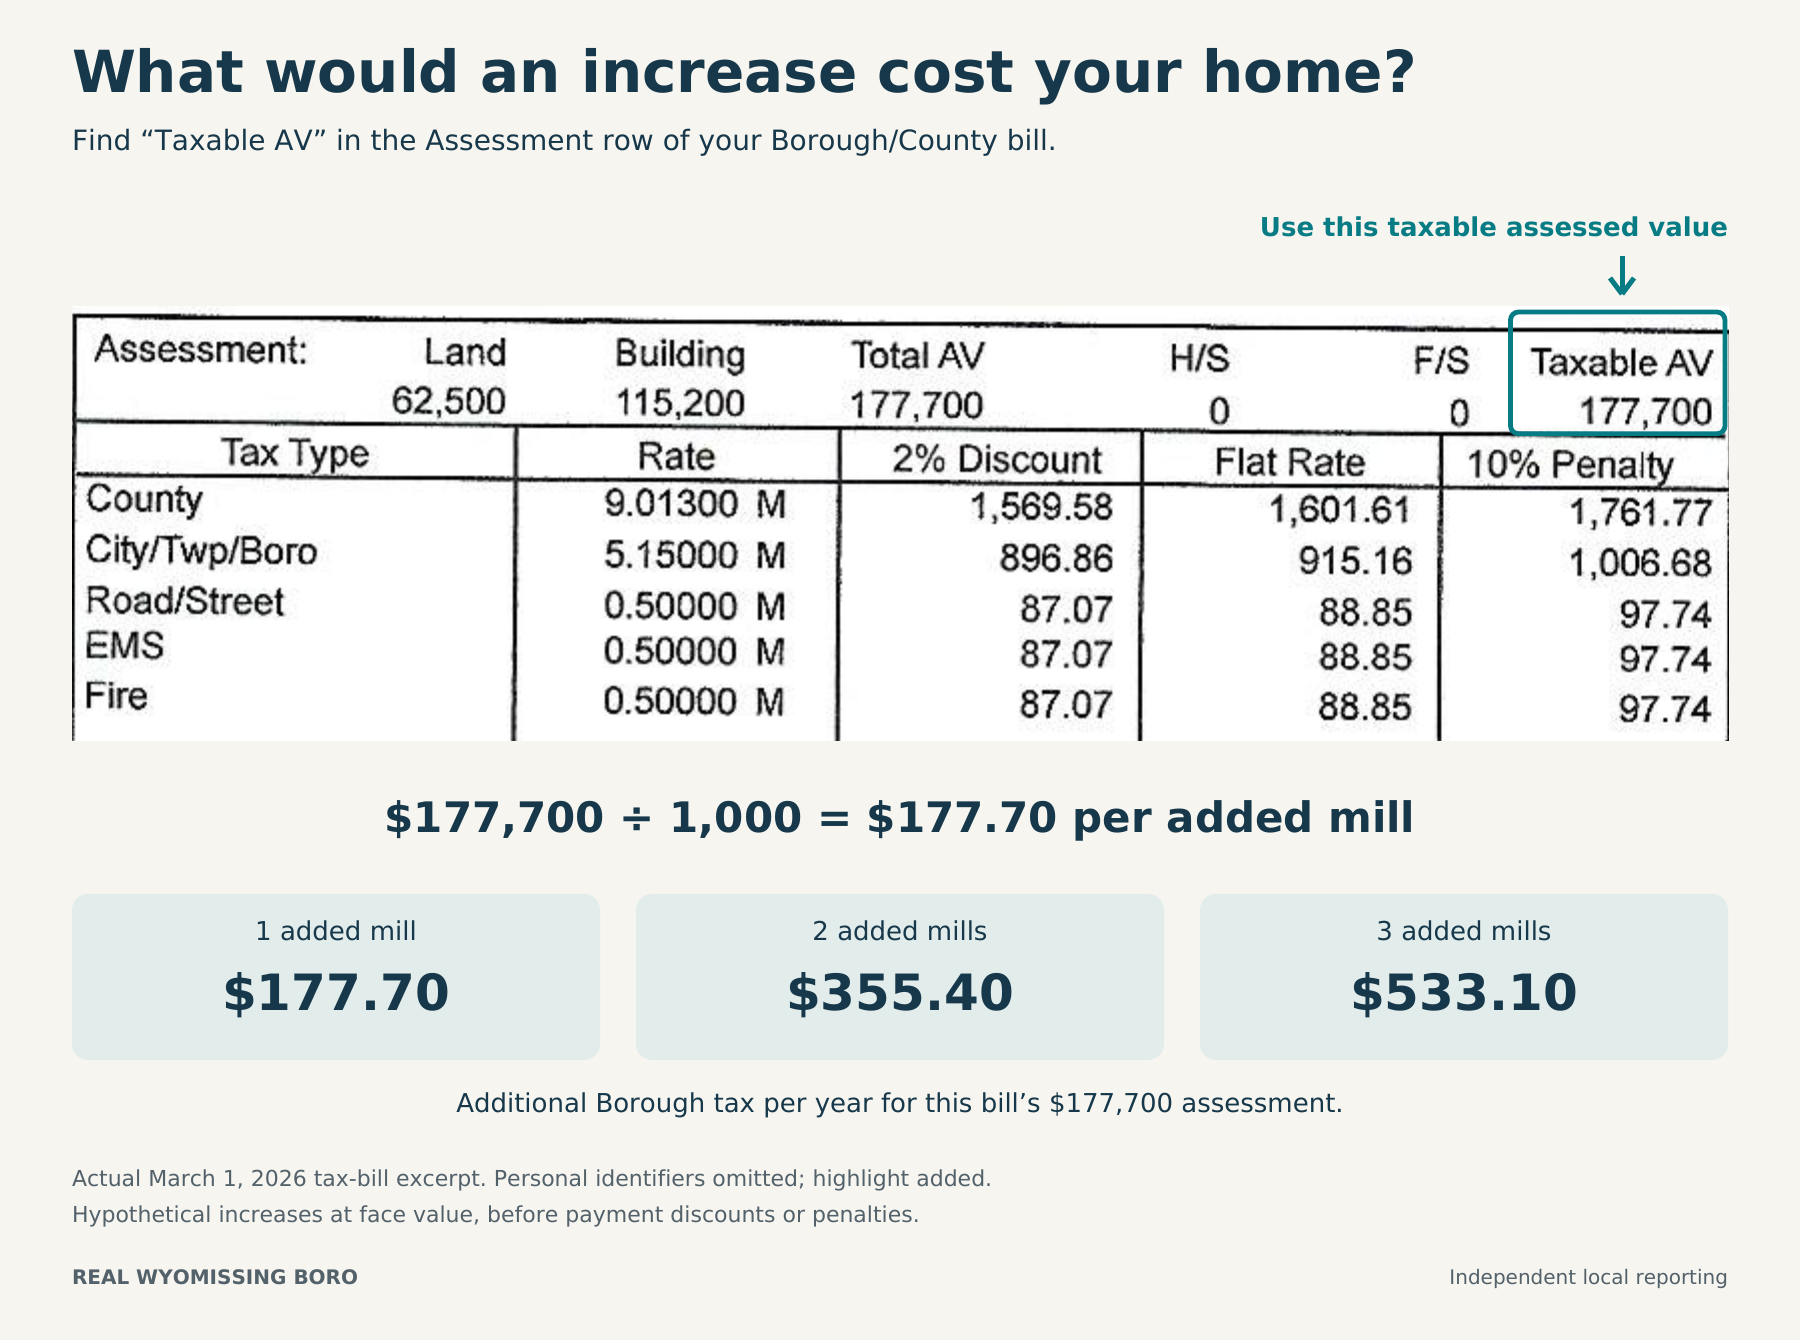
The sample bill shown here has a Taxable AV of $177,700. Divide that figure by 1,000 to find the cost of one added mill:
$177,700 ÷ 1,000 = $177.70 more per year.
Two added mills would cost $355.40; three would cost $533.10. You can do the same calculation with your own Borough taxable assessment:
| Added mills | Additional annual Borough tax |
|---|---|
| 1 mill | $177.70 |
| 2 mills | $355.40 |
| 3 mills | $533.10 |
Taxable assessment ÷ 1,000 × added mills = additional annual Borough tax.
A mill is a small-looking number in a budget discussion. Its household cost depends on the assessment it is applied to. When Council weighs an increase, residents should be able to see both sides: what the Borough expects to collect and what different households would pay. Then comes the public question: What would the extra money fund?
Sources and method
Figures come from Berks County's 2026 assessment data downloaded October 21, 2026. The $1.037 billion figure is recorded assessed value, not current market value or a certified Borough taxable base. The Borough-wide table applies each rate to the entire recorded parcel sum; exemptions, assessment adjustments and collection results must be accounted for before calling those figures expected revenue. The download date is not a certified roll-effective date.
The house figures cover the defined 3,056 one-family properties, not every home or a verified detached-only or owner-occupied-only group. Another 21 one-family-coded records with missing/conflicting unit counts are excluded. “Lowest” and “highest” refer to assessments within that group, not the Borough's cheapest or most expensive homes by sale price. These are hypothetical additions to Borough property tax, not complete Borough/County/school bills or a statement that an increase has been proposed or adopted. Calculations use the unrounded average before rounding tax amounts to cents. All illustrated increases are at face value, before payment discounts or penalties. Use the taxable assessment applicable to the Borough lines; a County or school-tax assessment should not automatically be substituted.
- Berks County assessment page and CAMA exports.
- Official CAMA Master table.
- County CAMA data dictionary, physical PDF pages 20–22 for one-family codes.
Information is based on geospatial data from the County of Berks.
Real Wyomissing Boro is independent and is not affiliated with the Borough of Wyomissing.